Файл:2014 militrary expenditures absolute.svg
Перейти до навігації
Перейти до пошуку

Розмір цього попереднього перегляду PNG для вихідного SVG-файлу: 512 × 288 пікселів. Інші роздільності: 320 × 180 пікселів | 640 × 360 пікселів | 1024 × 576 пікселів | 1280 × 720 пікселів | 2560 × 1440 пікселів.
Повна роздільність (SVG-файл, номінально 512 × 288 пікселів, розмір файлу: 1,52 МБ)
| Відомості про цей файл містяться на Вікісховищі — централізованому сховищі вільних файлів мультимедіа для використання у проектах Фонду Вікімедіа. |
Опис файлу
| Опис |
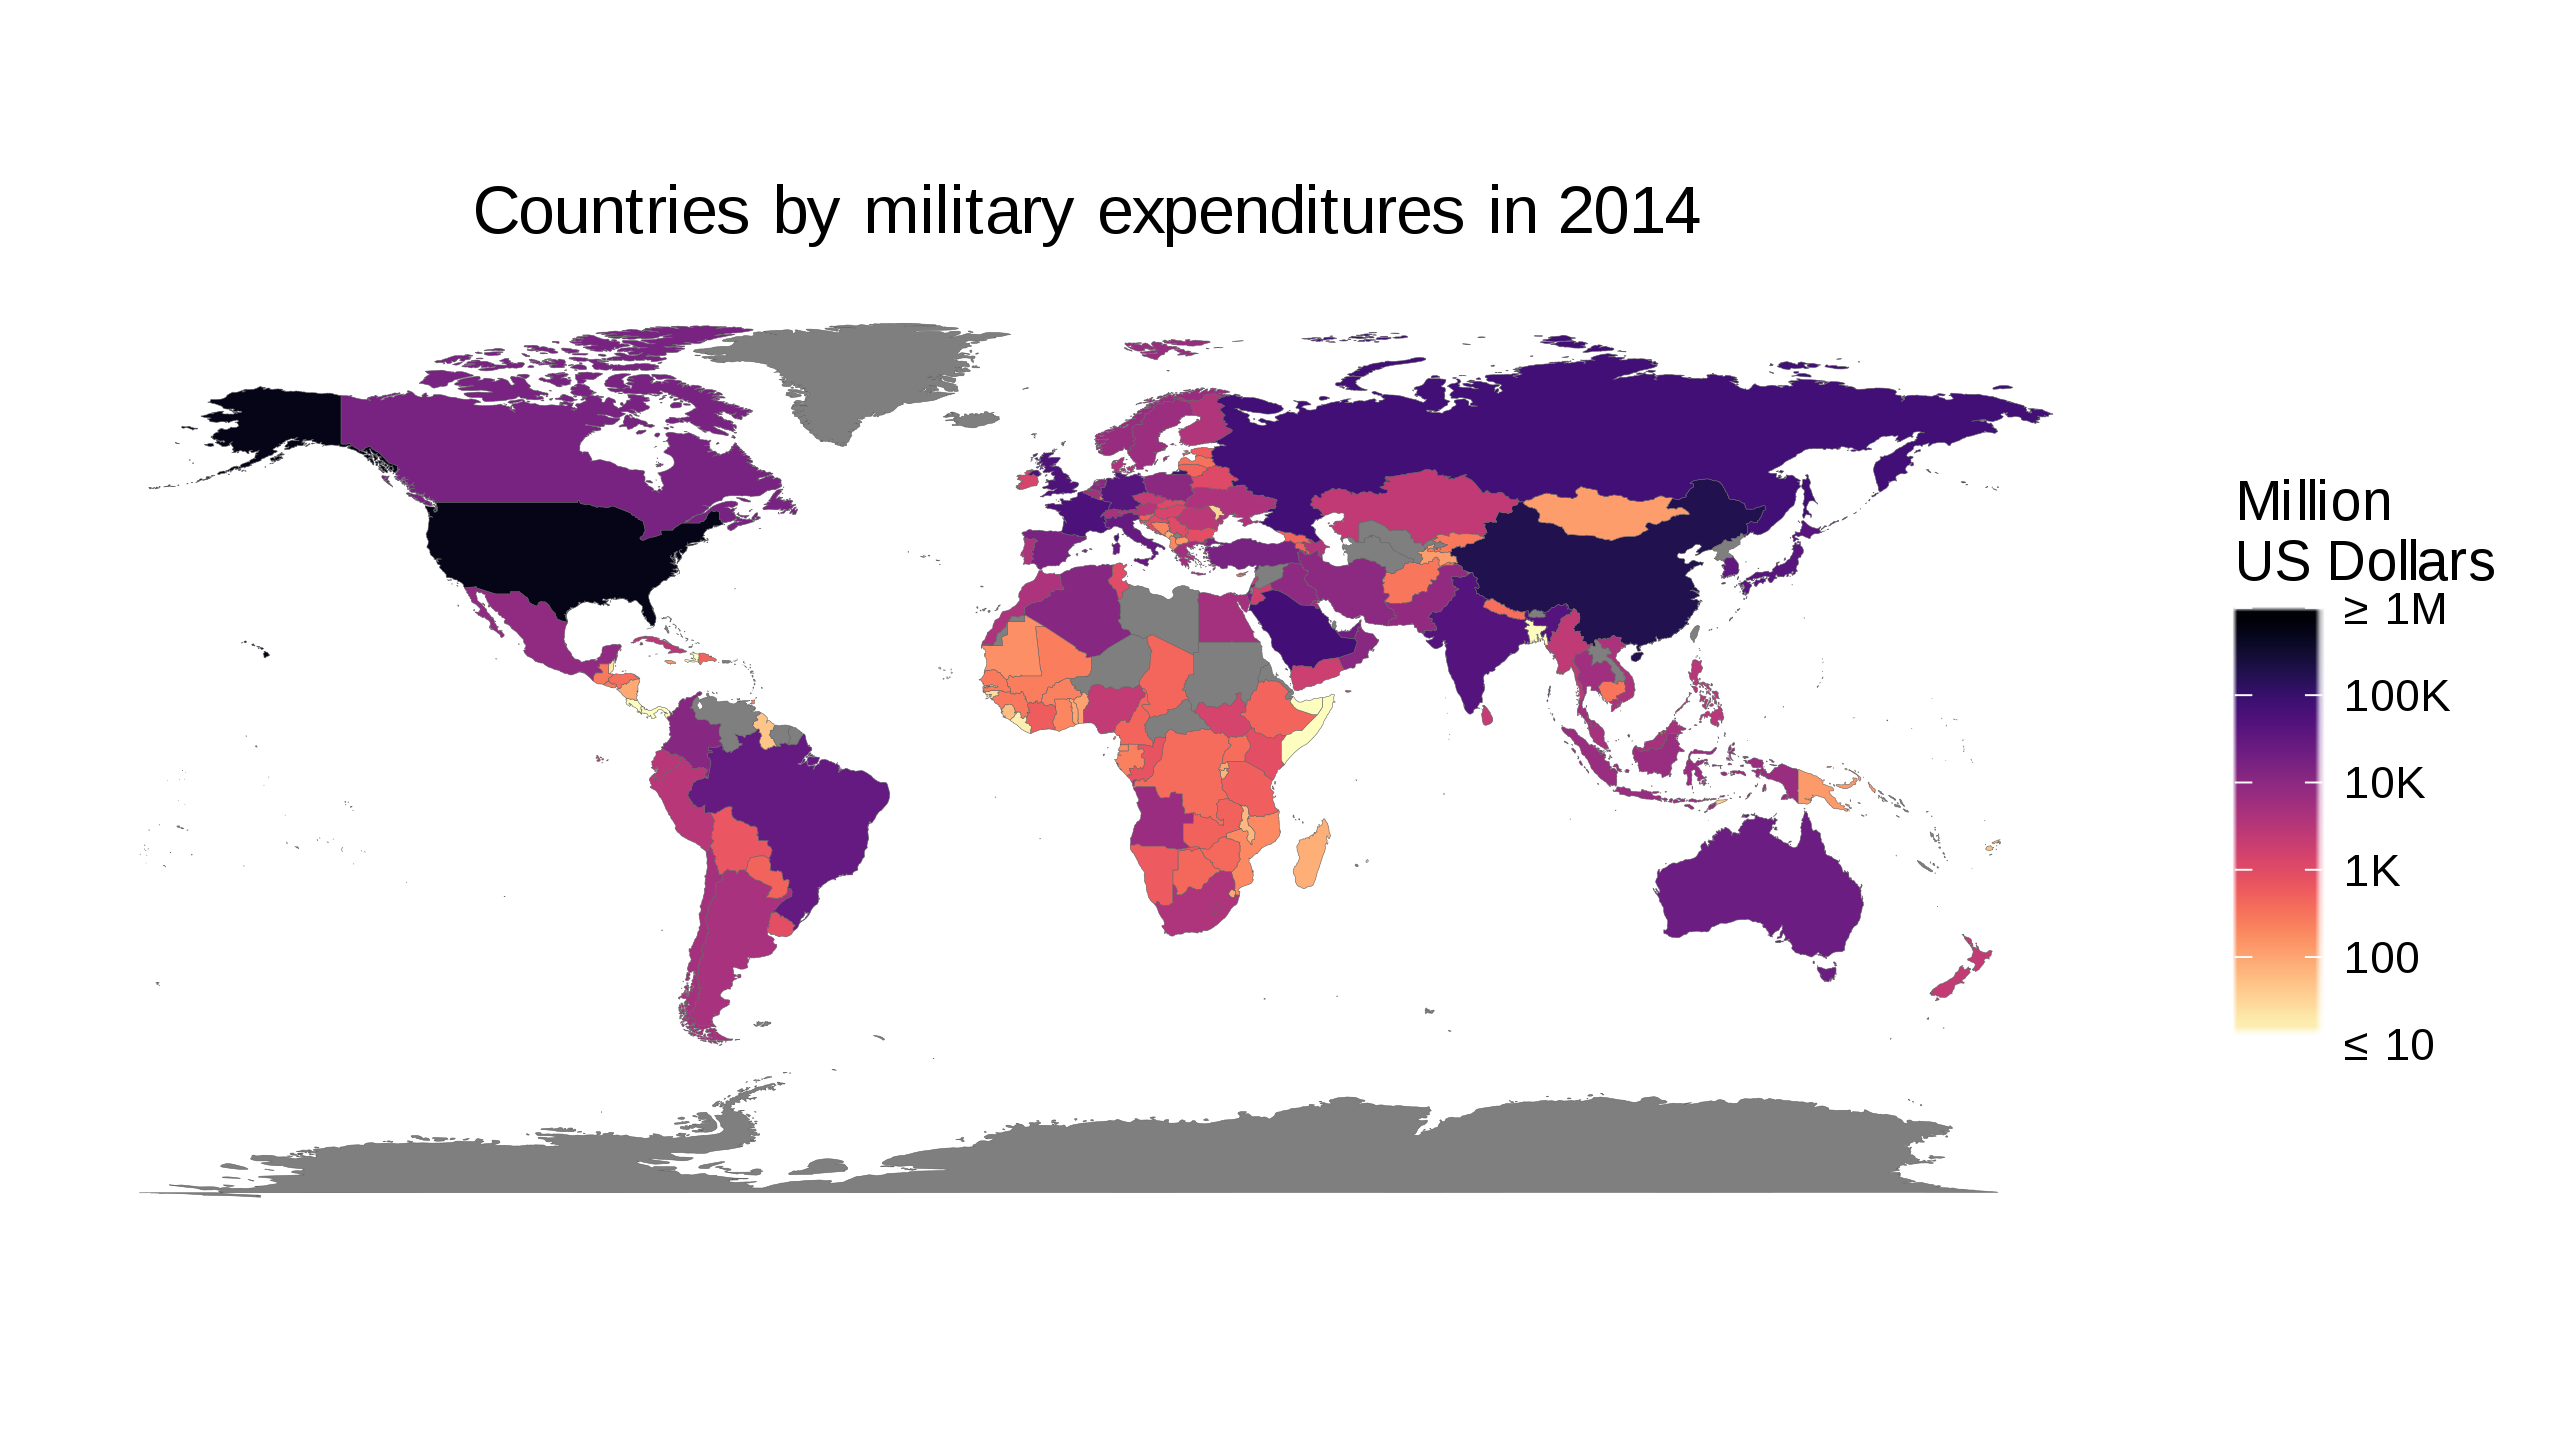
English: Based on the Worldbank data from http://data.worldbank.org/indicator/MS.MIL.XPND.GD.ZS and http://data.worldbank.org/indicator/NY.GDP.MKTP.CD This is a candidate for replacing/augmenting https://commons.wikimedia.org/wiki/File:Countries_by_Military_expenditures_(%25_of_GDP)_in_2014_v2.svg |
| Джерело | Власна робота |
| Автор | Pipping |
_in_2014_v2.svg)
Ліцензування
Я, власник авторських прав на цей твір, добровільно публікую його на умовах такої ліцензії:
Цей файл ліцензований на умовах Creative Commons Із зазначенням автора - Розповсюдження на тих самих умовах 4.0 Міжнародна
- Ви можете вільно:
- ділитися – копіювати, поширювати і передавати твір
- модифікувати – переробляти твір
- При дотриманні таких умов:
- зазначення авторства – Ви повинні вказати авторство, надати посилання на ліцензію і вказати, чи якісь зміни було внесено до оригінального твору. Ви можете зробити це в будь-який розсудливий спосіб, але так, щоб він жодним чином не натякав на те, наче ліцензіар підтримує Вас чи Ваш спосіб використання твору.
- поширення на тих же умовах – Якщо ви змінюєте, перетворюєте або створюєте іншу похідну роботу на основі цього твору, ви можете поширювати отриманий у результаті твір тільки на умовах такої ж або сумісної ліцензії.
Created with the following piece of code:
library(magrittr)

selectedYear <- 2014

getWorldBankData <- function(indicatorCode, indicatorName) {
    baseName <- paste('API', indicatorCode, 'DS2_en_csv_v2', sep='_')
    ## Download zipfile if necessary
    zipfile <- paste(baseName, 'zip', sep='.')
    if (!file.exists(zipfile)) {
        zipurl <- paste(paste('http://api.worldbank.org/v2/en/indicator',
                              indicatorCode, sep='/'),
                        'downloadformat=csv', sep='?')
        download.file(zipurl, zipfile)
    }
    csvfile <- paste(baseName, 'csv', sep='.')
    ## This produces a warning because of the trailing commas. Safe to ignore.
    readr::read_csv(unz(zipfile, csvfile), skip=4,
                    col_types = list(`Indicator Name` = readr::col_character(),
                                     `Indicator Code` = readr::col_character(),
                                     `Country Name` = readr::col_character(),
                                     `Country Code` = readr::col_character(),
                                     .default = readr::col_double())) %>%
        dplyr::select(-c(`Indicator Name`, `Indicator Code`, `Country Name`))
}

## Obtain and merge World Bank data
worldBankData <-
    dplyr::left_join(
               getWorldBankData('MS.MIL.XPND.GD.ZS') %>%
               tidyr::gather(-`Country Code`, convert=TRUE,
                             key='Year', value=`Military expenditure (% of GDP)`,
                             na.rm = TRUE),
               getWorldBankData('NY.GDP.MKTP.CD') %>%
               tidyr::gather(-`Country Code`, convert=TRUE,
                             key='Year', value=`GDP (current US$)`,
                             na.rm = TRUE)) %>%
    dplyr::mutate(`Military expenditure (current $US)` =
                      `Military expenditure (% of GDP)`*`GDP (current US$)`/100) %>%
    dplyr::filter(Year == selectedYear) %>%
    dplyr::mutate(Year = NULL)

## Plotting: Obtain Geographic data
mapData <- tibble::as.tibble(ggplot2::map_data("world")) %>%
    dplyr::mutate(`Country Code` =
                      countrycode::countrycode(region, "country.name", "iso3c"),
                  ## This produces a warning but I do not see how we could do better
                  ## since we started with fuzzy names.
                  region = NULL, subregion = NULL)

combinedData <- dplyr::left_join(mapData, worldBankData)

## The default out-of-bounds function `censor` replaces values outside
## the range with NA. Since we have properly labelled the legend, we can
## project them onto the boundary instead
clamp <- function(x, range = c(0, 1)) {
    lower <- range[1]
    upper <- range[2]
    ifelse(x > lower, ifelse(x < upper, x, upper), lower)
}

ggplot2::ggplot(data = combinedData, ggplot2::aes(long,lat)) +
    ggplot2::geom_polygon(ggplot2::aes(group = group,
                                       fill  = `Military expenditure (current $US)`),
                          color = '#606060', lwd=0.05) +
    ggplot2::scale_fill_gradientn(colours= rev(viridis::magma(256, alpha = 0.5)),
                                  name   = "Million\nUS Dollars",
                                  trans  = "log",
                                  oob    = clamp,
                                  breaks = c(1e7,1e8,1e9,1e10,1e11,1e12),
                                  labels = c('\u2264 10', '100', '1K',
                                             '10K', '100K', '\u2265 1M'),
                                  limits = c(1e7,1e12)) +
    ggplot2::coord_fixed() +
    ggplot2::theme_bw() +
    ggplot2::theme(plot.title = ggplot2::element_text(hjust = 0.5),
          axis.title = ggplot2::element_blank(),
          axis.text = ggplot2::element_blank(),
          axis.ticks = ggplot2::element_blank(),
          panel.grid.major = ggplot2::element_blank(),
          panel.grid.minor = ggplot2::element_blank(),
          panel.border = ggplot2::element_blank(),
          panel.background = ggplot2::element_blank()) +
    ggplot2::labs(title = paste("Countries by military expenditures in",
                                selectedYear))

ggplot2::ggsave(paste(selectedYear, 'militrary_expenditures_absolute.svg', sep='_'),
                height=100, units='mm')
Історія файлу
Клацніть на дату/час, щоб переглянути, як тоді виглядав файл.
| Дата/час | Мініатюра | Розмір об'єкта | Користувач | Коментар | |
|---|---|---|---|---|---|
| поточний | 14:30, 20 травня 2017 | | 512 × 288 (1,52 МБ) | Pipping | redo with dplyr |
| 12:12, 13 травня 2017 |  | 512 × 256 (1,51 МБ) | Pipping | Handle truncation of the data range better: We distinguish between 0 and no data, but any existing datum below 10M USD is coloured the same way and all data above 1T USD are coloured the same way. The legend makes this clear. | |
| 08:55, 13 травня 2017 |  | 512 × 256 (1,51 МБ) | Pipping | Completely redone. The former was in local currency (so that comparisons from country to country made absolutely no sense). Now everything is in current US dollars. | |
| 22:32, 11 травня 2017 |  | 512 × 256 (1,5 МБ) | Pipping | Fixed min/max value for colors that kept anything below 1,000,000,000 US dollars from having a colour (now: Anything above 1,000,000 US dollars has a colour). | |
| 21:30, 11 травня 2017 |  | 512 × 256 (1,51 МБ) | Pipping | {{Information |Description ={{en|1=English: Based on the Worldbank data from http://data.worldbank.org/indicator/MS.MIL.XPND.CN This is a candidate for replacing/augmenting https://commons.wikimedia.org/wiki/File:Countries_by_Military_expenditures_(... |
Використання файлу
Така сторінка використовує цей файл:
Глобальне використання файлу
Цей файл використовують такі інші вікі:
- Використання в bg.wikipedia.org
- Використання в ca.wikipedia.org
- Використання в en.wikipedia.org
- Використання в eu.wikipedia.org
- Використання в sr.wikipedia.org
- Використання в th.wikipedia.org